We are facing this issue: suddenly Dremio eats more memory than expected, reaching almost 100% of OS, probably almost causing a system collapse. The service remains working, however it is extremely dangerous considering it’s a production system.
Which tool are you using to view memory consumption?
Dremio should use only what’s allocated to it using the setting you mentioned. The Admin->Node Activity is showing the percentage of that allocation that is being used.
however it is extremely dangerous considering it’s a production system.
Depending on your OS, you should reserve a minimum amount of memory system services to function. I looks like you’ve reserved 3 GB for everything else on the node. You may want to scale the memory or reduce Dremio’s allocation.
So, there’s a routine or configuration to ensure that Dremio sets free memory, such as GC configuration? Our cluster isn’t under heavy charge, what seems to be memory allocation over the time that’s never freed.
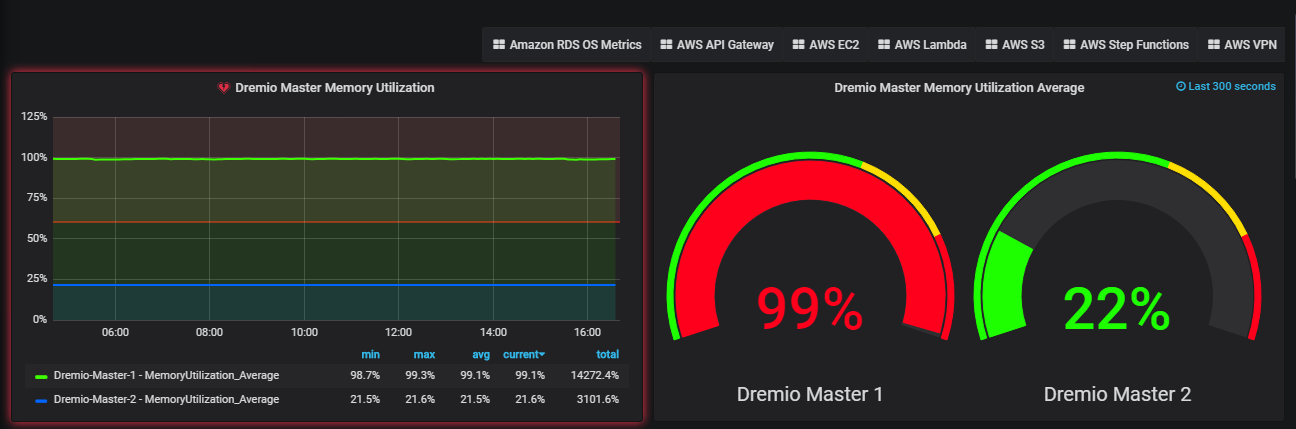
I’m not sure what goes into the Grafana calculation of these numbers, so I can’t speak to what it’s reporting. If Dremio is using all of that memory, it would leave only a few hundred MB for the system. On that node, what do the system tools tell you? For example top -pid [dremio pid]
If you are using the JMX monitoring, then you are interacting with the MemoryMXBean which let’s you monitor heap and direct memory usage from the memory pools that the JVM has control of. I believe this monitoring doesn’t know anything about system memory usage outside of the Java process being monitored. When Grafana says 99% usage, is there a byte value it reports as well? Is this 99% of 29 GB?